Imagine a stock’s price is like a bouncing ball inside a room – the floor below is support, and the ceiling above is resistance. The ball bounces off the floor (price rises when it hits support) and hits the ceiling (price falls when it hits resistance). Understanding support and resistance helps you predict where the price might stop and reverse.
What are Support and Resistance?
Support: This is a price level where a stock tends to stop falling and bounce back up. It’s like a floor that supports the price. Why does this happen? Often because as the price gets cheaper, more buyers are interested and step in, creating demand that holds the price up. For example, if Maruti Suzuki shares have fallen to around ₹6,500 multiple times and each time they went back up afterward, ₹6,500 is acting as a support level – buyers find that price attractive and repeatedly buy there, preventing further decline. It’s a level where people say “the stock is cheap enough here, I’ll buy.”
Resistance: This is a price level where a stock tends to stop rising and maybe head back down – like a ceiling it struggles to break through. At resistance, selling pressure (supply) often increases because traders think the price is too high or want to take profits. For instance, suppose TCS stock has approached ₹4,000 a few times but never manages to cross above ₹4,000 – each attempt stalls and the price falls back. ₹4,000 becomes a resistance level since sellers consistently emerge at that price (perhaps investors feel ₹4,000 is a fair high value and start selling to take profits each time it gets there).
Identifying Key Levels on a Chart:
Finding support and resistance is a bit of an art, but there are some simple steps:
Look Left: When examining a chart, “look left” (past price history) to see where the price previously stopped falling and turned up (potential supports) or stopped rising and turned down (potential resistances). Mark those price levels.
Multiple Touches: The strongest support/resistance levels are those that the price has touched multiple times. If a stock bounced off ₹500 on three separate occasions over several months, ₹500 is a solid support. Similarly, if it hit ₹750 and fell back twice, ₹750 is a clear resistance.
Round Numbers: In the Indian market, nice round figures (like ₹100, ₹500, ₹1000, ₹10,000 for indices) often act as psychological support or resistance. Many traders place buy/sell orders around those numbers. For example, the NIFTY 50 index often finds psychological resistance near big round numbers (like 18,000 or 20,000 points) where investors get jittery about pushing it higher.
Recent Highs and Lows: Yesterday’s high might become today’s resistance, and yesterday’s low could become today’s support for short-term trading. For longer-term, last month’s high could act as resistance, etc.
Examples from Indian Stocks:
Let’s bring this to life with a couple of examples:
Example 1: Support: State Bank of India (SBI) shares traded around ₹500-₹520 for several weeks. Whenever the price dipped to around ₹500, it quickly bounced back, as buyers came in thinking SBI was a good buy at that price. ₹500 became an obvious support. If you were charting SBI, you’d draw a line at ₹500 and watch that level in the future – if SBI’s price approaches ₹500 again, you might expect it to bounce unless some new negative news breaks the support.
Example 2: Resistance: Reliance Industries might find resistance around ₹2,500 if historically it has struggled to climb above that. Say it hit ₹2,500 in June and dropped, then tried again in July, got to ₹2,480 and fell again. Traders would mark ₹2,500 as resistance. If Reliance approaches ₹2,500 a third time, many traders might decide to sell or be cautious, anticipating another pullback from that resistance.
Support-Turned Resistance and Vice Versa:
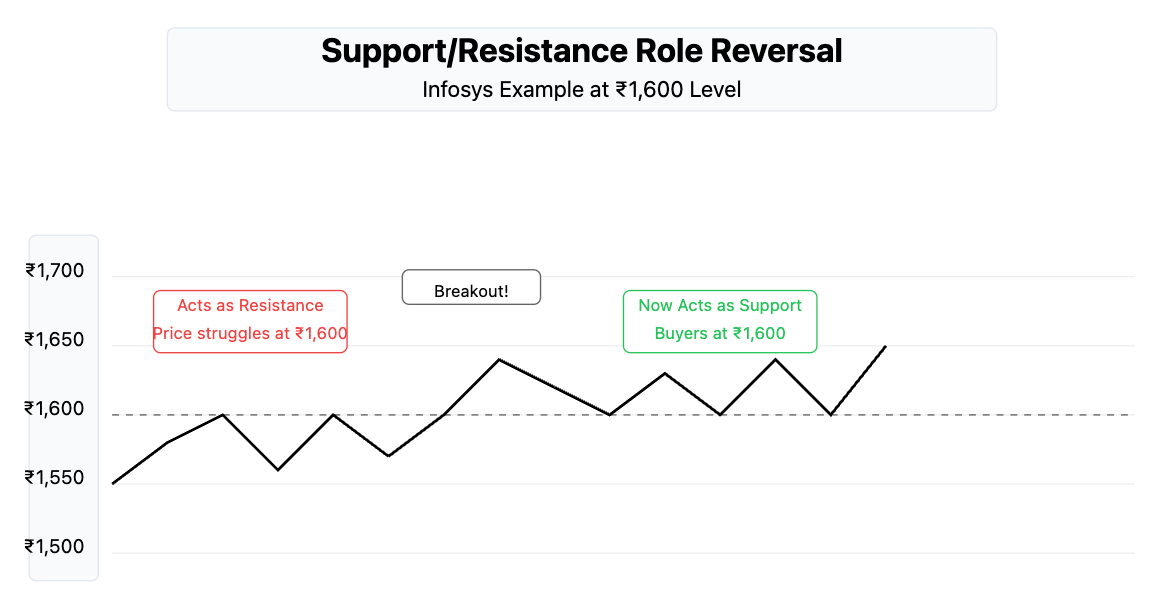
A neat thing about these levels is that if a price breaks through a strong support or resistance, their roles can flip. That is, when price breaks above a resistance, that level can become new support (because what was a ceiling is now a floor). And if price breaks below a support, that level can act as new resistance (a broken floor becomes a ceiling). You’ll see this often. For example, if Infosys finally breaks out above ₹1,600 (a resistance level), then ₹1,600 might become a support level during future pullbacks, as traders who missed the breakout look to buy if it dips back to that price
Knowing support and resistance helps you make trading decisions like where to buy or sell. Many traders try to buy near support (where downside is limited and upside potential is bigger) and sell near resistance. It also helps in setting stop-losses (you might put a stop-loss just below a support level, because if the price falls below support, that’s a warning sign of further decline). In the next module, we’ll add another layer to our charts – moving averages – which help in understanding the trend direction and smoothing out the noise.


