

Volume is the unsung hero of chart analysis. While price tells you what moved, volume tells you how enthusiastic (or hesitant) the market was about that move. Every price move is more meaningful when accompanied by significant volume. This module will show you how to use volume to confirm trends, spot potential reversals, and gauge market sentiment. We’ll also touch on how volume reflects the crowd’s emotion – fear or greed – in the market.
The Role of Volume in Confirming Trends:
Volume Up, Trend Up: In a healthy uptrend, you often see higher volume on days when the price goes up, and relatively lower volume on pullback days. This suggests that the big moves (buying) are backed by a lot of participants (strong interest), and when the price dips, fewer people are trading (so likely just profit-taking, not mass selling). For example, if Nifty 50 is climbing and on rally days trading volume is, say, 50,000 crore rupees worth of shares, but on minor down days volume drops to 20,000 crore, it indicates the trend is underpinned by real buying power

Volume Up, Trend Down: Similarly, in a downtrend, you want to see higher volume on the down days and lighter volume on bounces, confirming that rallies are weak (few buyers) and sell-offs are strong (many sellers).
Divergence – a Warning: If a trend is continuing but volume is drying up, that can be a warning sign. For instance, a stock making new highs on decreasing volume might be running out of new buyers – a hint that the trend may stall or reverse. Alternatively, a stock falling on declining volume might indicate selling pressure is easing (possible bottom forming)


Using Volume for Breakouts and Breakdowns:
When a stock breaks out above a resistance level (say a range or a chart pattern we discussed), a surge in volume is like a big thumbs-up from the market. It means many traders are participating in the move, lending credibility. For example, Axis Bank was stuck between ₹700 and ₹750 for a while. If it suddenly moves above ₹750 and you see that volume for the day is twice the average, that's a strong breakout. Traders often say "volume confirms the breakout." In contrast, if Axis Bank barely creeps above ₹750 on very low volume, one might be cautious – the breakout might not sustain because it lacked broad support.
On a breakdown below support, the same idea: heavy volume on the drop suggests panic or strong conviction among sellers (more reliable breakdown), whereas a light-volume drop might not carry on far.

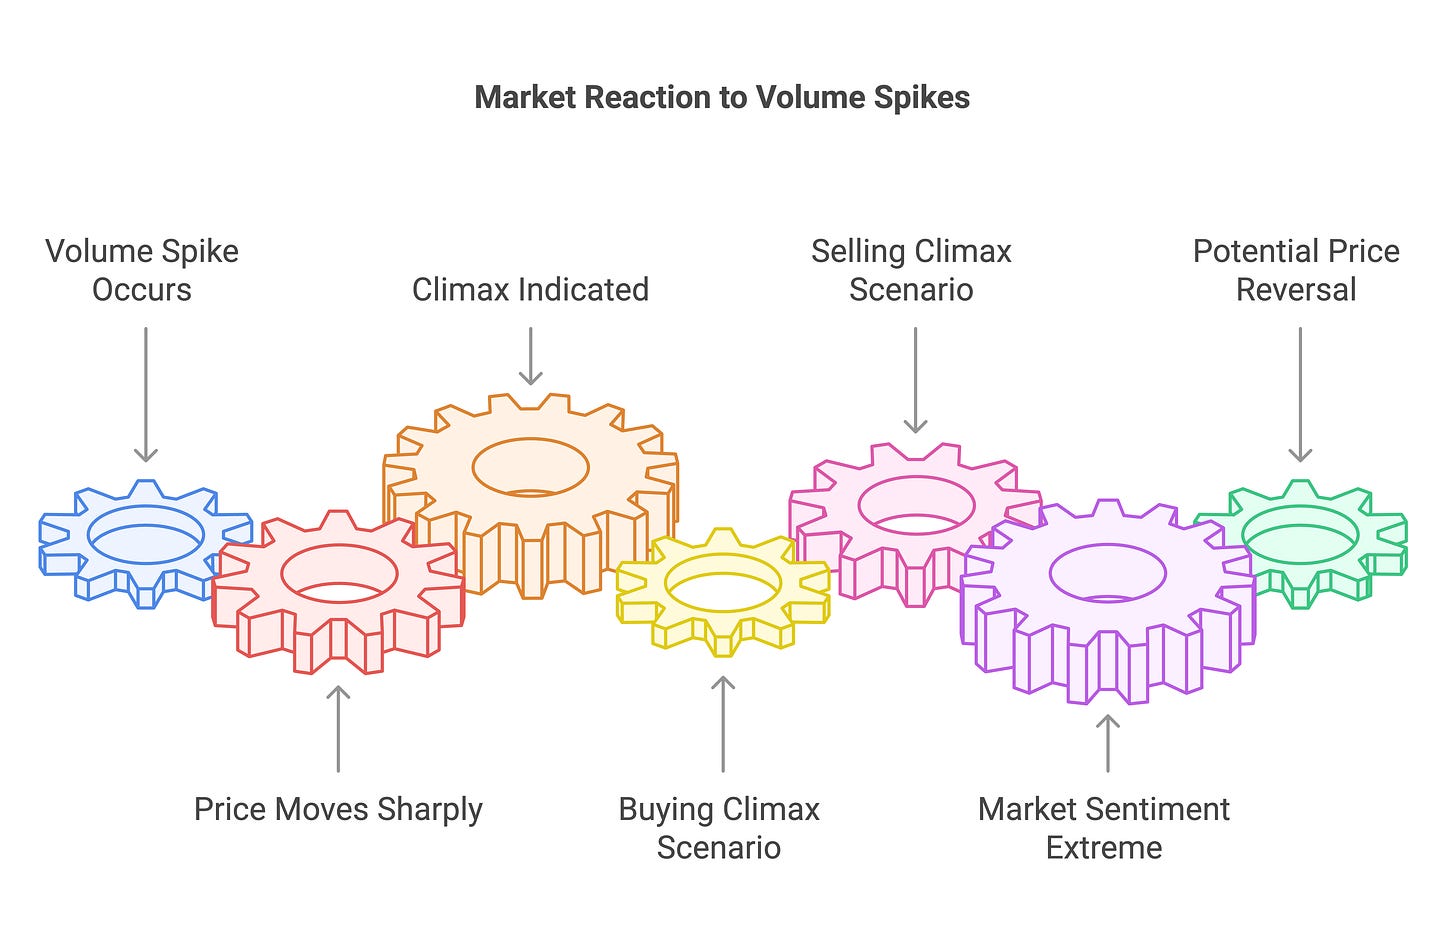
Volume Spikes and Climax Moves:
Sometimes you’ll see an unusually large volume spike accompanying a sharp price move. This can indicate a climax – either a buying climax (blow-off top) or a selling climax (capitulation). For example, imagine YES Bank (when it was volatile) shoots up from ₹14 to ₹18 in one day on massive volume that’s 5x the average. This could be a blow-off top, meaning everyone who wanted to buy piled in that day, exhausting the buyers, and the next day the stock might actually start falling because there’s no one left to buy at the high price. Conversely, if a stock crashes with a giant volume spike, it might mean all the panicked selling happened and from there, with only buyers left willing at that low price, it could bounce.
Volume spikes often mark turning points because they represent extreme sentiment (either euphoria or fear hitting a peak)
.

Market Sentiment Through Volume (and other clues):
Bullish Sentiment: High volume on up-moves, stocks across the board rising, lots of positive buzz/news – these indicate bullish sentiment. In India, you might notice during a bull run phase that even mid-cap and small-cap stocks see volumes jump as retail participation increases with optimism.
Bearish Sentiment: High volume on down days, increased trading in puts or hedging instruments, and a general fear in news – these signal bearish sentiment. For instance, during a market correction, you may see volumes spike as people rush to sell or institutions rotate out of equities.
There’s also something called volume dry-up during quiet periods. If a stock’s volume has been very low for a while, it means traders are indecisive or uninterested – sometimes that precedes a big move once interest returns. It’s like calm before a storm.
Apart from volume, sentiment can also be gauged from things like the advance-decline line (how many stocks are rising vs falling) or put-call ratios, but those are extra things beyond chart reading. Volume on your chart is a direct measure of participation.
Live Examples from Indian Markets:
During the Union Budget announcements or RBI policy days, volumes usually spike on index stocks like State Bank of India, Reliance, TCS etc. If the market likes the budget (bullish sentiment), you might see the Nifty shoot up 3% on budget day on huge volume – a clear sign that sentiment turned very positive and money flowed in aggressively.
Consider a mid-cap stock like Delta Corp (just as an example). If there’s a rumor or news, you might see a dull trading volume of a few lakh shares suddenly jump to several million shares on a big price move. That volume jump tells you something significant changed in sentiment – lots of new buyers or sellers showed up. Maybe it’s a breakout from a long consolidation with people finally excited to buy, or a breakdown with everyone rushing for the exit.
Another example: Volume confirming support/resistance – Say Bharti Airtel is approaching a support at ₹600. If the stock falls to ₹605 with volume decreasing on the way down, and at ₹600 you actually see a volume spike on a small bullish candlestick, it could indicate strong buying (support holding). Many traders look for such volume clues to see if support is indeed a strong zone where big players are accumulating shares.
Practical Tips on Using Volume:
Always check volume bars below your chart: Get in the habit of glancing at volume when you see a big price move. Was the move on higher, average, or lower volume compared to recent days? This will tell you how significant that move might be.
Volume Average: Many charting tools (including Sahi app presumably) will show a moving average line on volume to indicate typical volume. Use that as a reference – moves with volume far above that line are noteworthy.
Confirming Breakouts: If you plan to trade breakouts, consider waiting for the day’s close or a decisive move with above-average volume. It can save you from false breakouts.
Volume + Pattern: Combine volume analysis with patterns. If you see a breakout from a Double Bottom pattern, check volume. Volume above average adds confidence to the trade.
Unusual Volume with no big price move: sometimes you may see very high volume but the price doesn’t move much (maybe a small candle). This could mean a big battle between buyers and sellers took place. It might precede a move once one side wins. Keep an eye out in subsequent days for direction


Volume is essentially the pulse of the market. Learning to read it will make you a more confident chart reader because you’ll understand not just price, but the participation and emotion behind those price moves.
Finally, we move to an aspect that is less about the charts themselves and more about you, the trader: trading psychology and risk management. This last module is crucial because even the best chart analysis can be undermined if emotions take over or if risks aren’t managed. Let’s explore that next.