Welcome to the first edition of our weekly Indicator Spotlight — where we break down one tool at a time, no jargon, no overcomplications, just what actually helps you trade better.
And we’re starting with a classic: the Simple Moving Average, or SMA.
It’s been around forever. And while traders love experimenting with EMAs, VWAPs, Supertrends, and more, this old-school line still earns its place on thousands of charts every single day.
What Is the SMA?
The Simple Moving Average does one thing — it smooths out price.
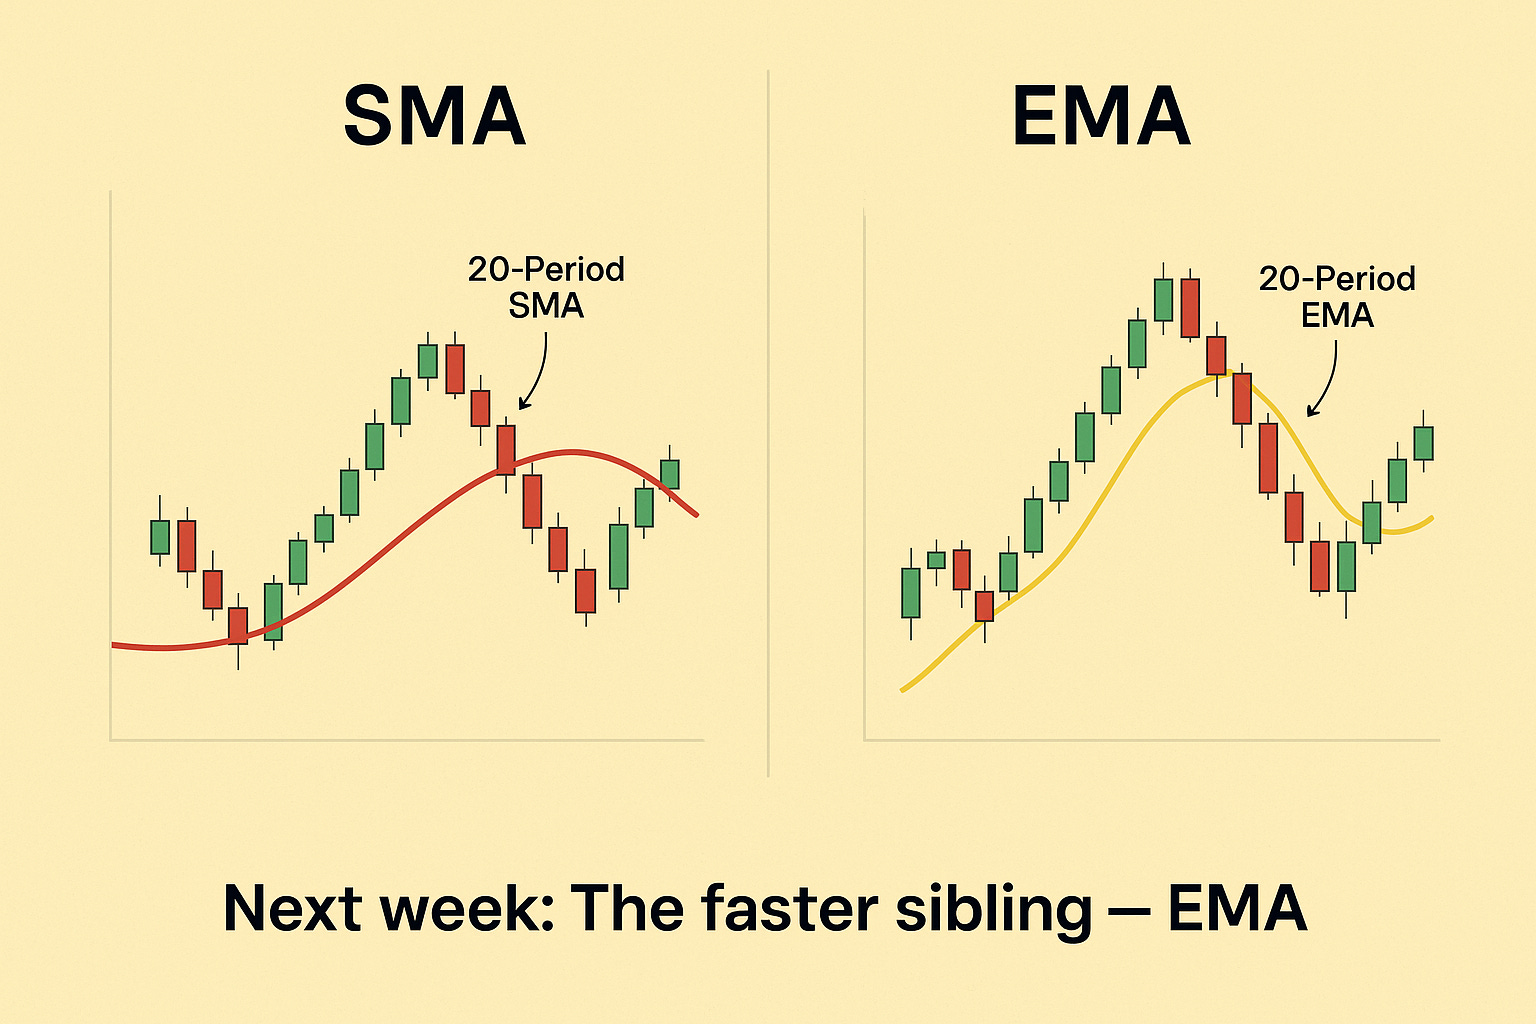
It calculates the average closing price over a defined number of candles. So a 20-period SMA simply tells you where price has generally been over the last 20 candles, softening the noise to help you focus on structure.
Think of it as your chart’s “calm voice in a volatile room.”
It doesn’t overreact. It just tracks the flow.
How Traders Use It
This is where the SMA becomes more than just a line. Depending on how you trade, it can serve different purposes:
For trend followers: When price stays above the SMA, the bias stays bullish. When it breaks below, you reassess.
For swing traders: The 50- or 200-SMA often acts as dynamic support or resistance — levels that price respects more often than not.
For confirmation setups: Combine SMA with RSI or MACD to stay out of trades when price is chopping sideways.
For exit plans: A flattening or downward-sloping SMA can be a subtle exit cue, telling you momentum is fading.

One underrated trick?
Watch the slope. If the SMA is clearly rising, you’re in a trend. If it starts flattening, that’s your heads-up. A rollover? That’s structure breaking down.
Common Pitfall to Avoid
The biggest mistake? Using the same SMA across every chart and every timeframe.
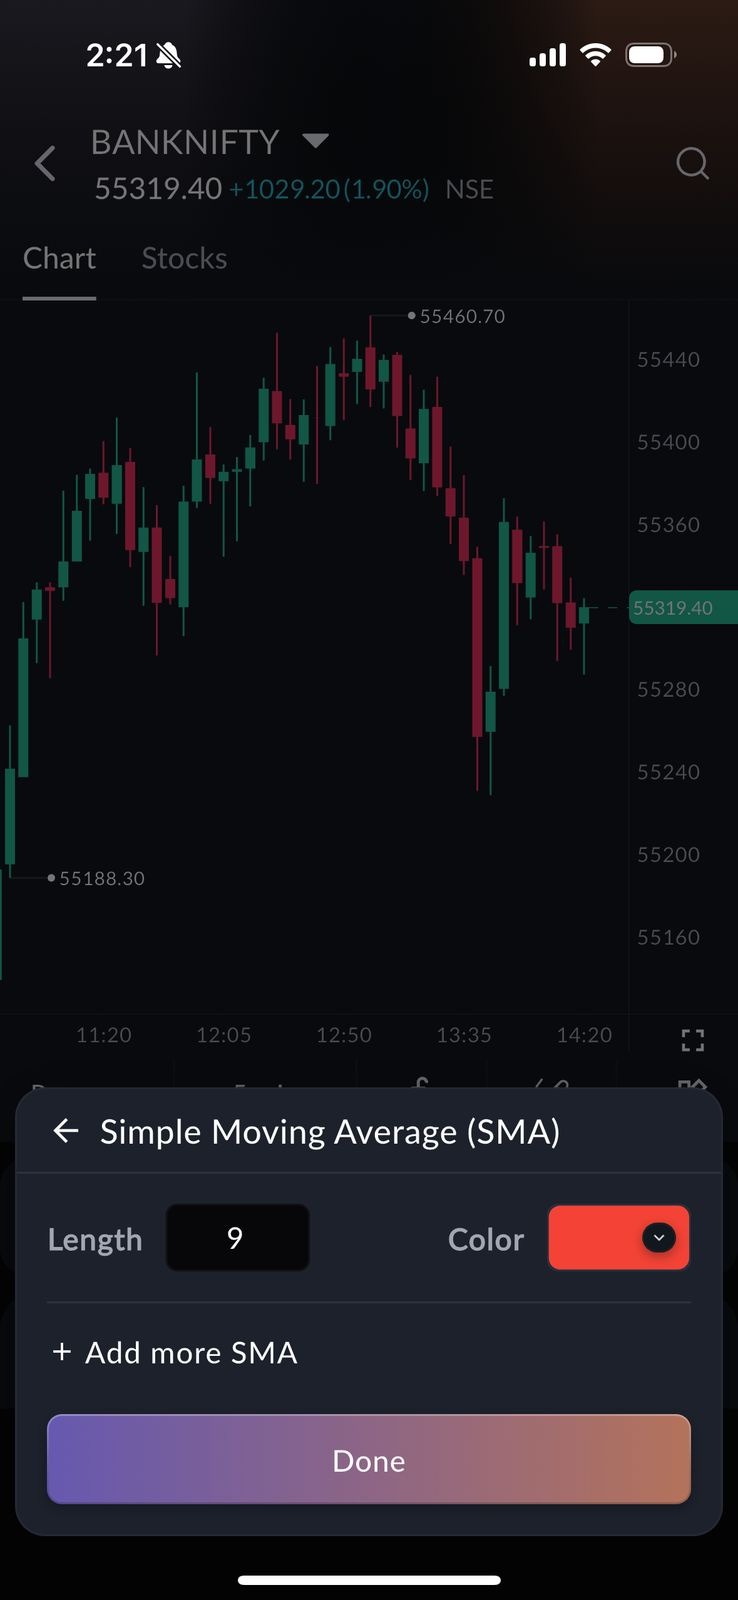
A 200-SMA might be meaningful on a daily chart but nearly useless on a 5-minute chart. Always adjust your SMA period to match your style — scalpers, swing traders, and positional players should not be using the same defaults.

Why We Decided to Keep It in Sahi
We kept the Simple Moving Average because it’s one of the few indicators that stays relevant no matter how you trade.
It doesn’t try to do too much — and that’s its strength.
Whether you’re using it to define trends, mark key zones, or just stay out of low-conviction setups, the SMA holds up. It’s reliable, flexible, and works quietly in the background without crowding the chart.
And in a world full of flashy, overcomplicated tools, that simplicity still goes a long way.
Next Stop: EMA
Next Monday, we’ll break down the Exponential Moving Average — the faster, more reactive sibling of the SMA. You’ll see when it works better and how to use it to catch early momentum without getting faked out.
Until then — trade clean, stay calm, and remember: the simplest lines often tell the clearest stories.