

You’ve seen the lines. You’ve probably drawn them once or twice.
And if you’re like most traders, you’ve also wondered, “Do these levels actually mean anything?”
This week, we’re breaking down Fibonacci Retracement — not as some mythical magic tool, but for what it is: a simple way to map pullbacks, set expectations, and spot potential bounce zones.
Let’s cover what it does, how to use it without getting superstitious, and why we still keep it in Sahi.
So What Is Fibonacci Retracement?
At its core, Fibonacci Retracement is a way to map potential pullback zones within a trend.
It’s based on a simple idea: after a strong move, price doesn’t usually go straight up (or down) forever. It pauses, pulls back, breathes — and then, maybe, continues.
Fib retracement levels help us measure how deep that pullback might go.
The most common levels?
38.2%, 50%, and 61.8%—these act like checkpoints where price often reacts, consolidates, or reverses.
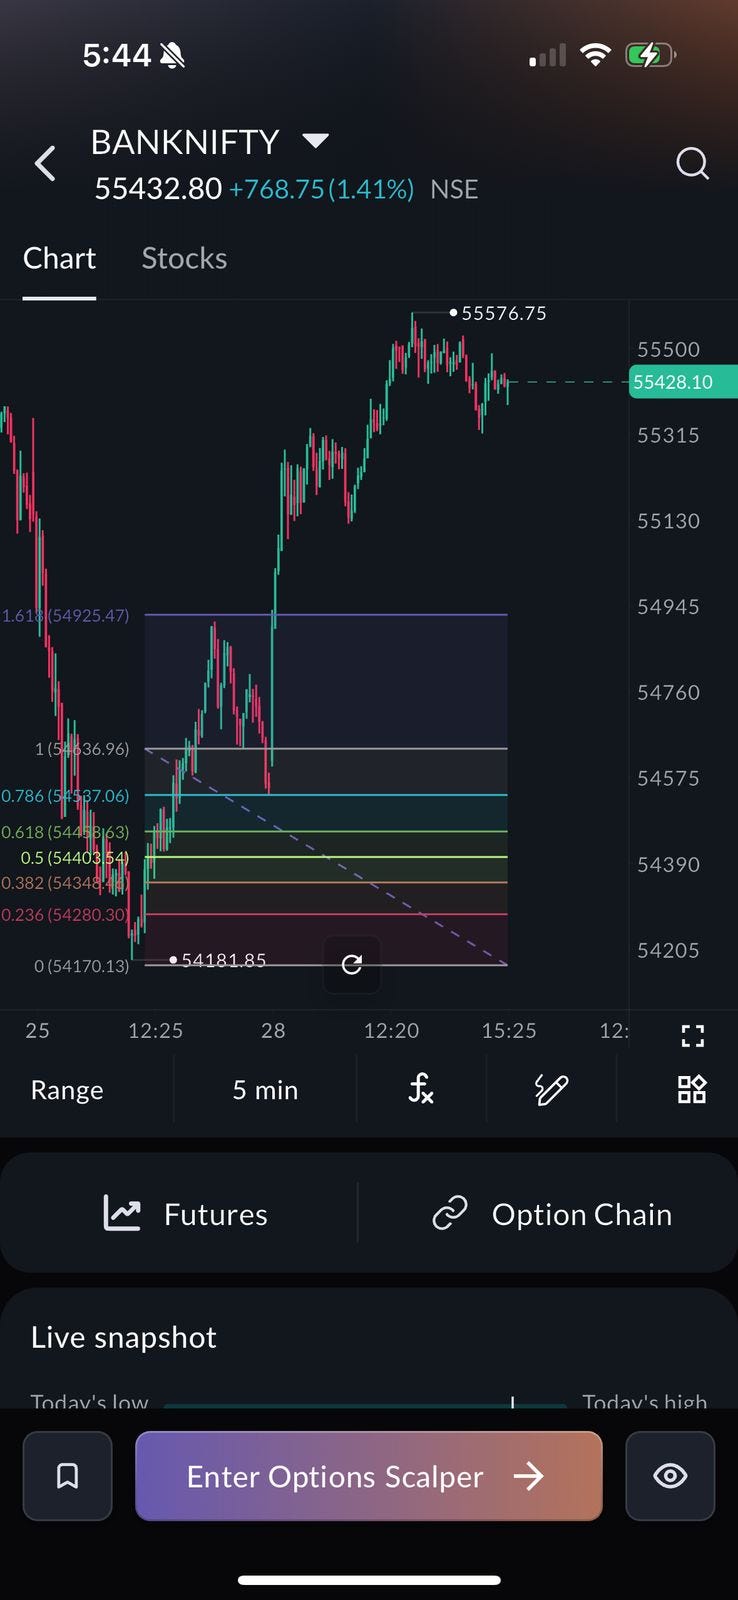
You draw it from the swing low to the swing high (in an uptrend) or the reverse in a downtrend. And boom —you’ve got a set of horizontal lines that mark key retracement zones.
It’s not about predicting the future. It’s about giving structure to the in-between.
Why Use Fibonacci Retracement?
Because markets move in waves, not straight lines.
And when emotions run high — after a breakout, a news event, or a panic drop — it’s easy to lose your sense of structure.
Fibonacci retracement offers a way to anchor your analysis to actual market behavior instead of guesses or gut feelings.
It helps you:
Define pullback zones instead of randomly picking entries.
Frame your risk by spotting areas where price might defend — or fail.
Stay patient during trend corrections instead of impulsively chasing moves.
Blend naturally with other setups — like moving averages, previous demand zones, or candlestick patterns.
You’re not using it because numbers like 38.2% or 61.8% are “magic.”
You’re using it because traders across the world watch them — and that collective attention is what creates the real edges.
At its best, Fibonacci is less about prediction and more about preparation.
How Traders Actually Use It (When It’s Not Just for Aesthetic)
Let’s be honest — Fibonacci retracement looks great on a chart, but it gets misused a lot.
It’s not about drawing lines and waiting for miracles.
It’s about reading the reaction when price gets to the important zones.
Here’s how it really plays out:
Imagine a stock that just rallied 12% in three sessions. You’re not buying the highs — that’s chasing.
You want the pullback, but not just anywhere.
So you plot a Fib from the swing low to the swing high.
Now, that zone between the 38.2% and 61.8% retracement becomes your watchlist.
It’s not guaranteed to bounce — but it’s where you expect price to either rebuild structure or show signs of weakness.
When price approaches these levels, you’re watching things like
Is volume thinning out as it drops? (No real sellers.)
Are wicks starting to form near the Fib lines? (Buyers defending.)
Is there overlap with other signals — like a 20 EMA, VWAP, or previous demand zone?
That’s when a Fib level shifts from “nice to know” to “now it matters.”
Because trading a Fib level isn’t about the line.
It’s about the behavior around the line.
If you get structure rebuilding — like higher lows forming near 50% or a bullish engulfing candle printing off 61.8% — that’s your real setup emerging.
If price slices straight through without a fight?
Move on. No second-guessing.
Fib retracement doesn’t predict turns.
It highlights where you should be paying extra attention — and where discipline matters more than opinion.
That’s the edge it offers when used right.
How to use it in Sahi
You’ll find it under the Drawing Tools section — just tap, anchor your swing, and start reading the retracement zones like a pro.
You asked. We listened.