

Every trader’s been there: price is nudging the highs, volume’s picking up, and the chart looks ready to pop. But the real question isn’t “Will it move?”
It’s: Is this a real move… Or just a trap?

That’s where Bollinger Bands step in, not to give buy/sell signals, but to help you frame price in context.
This week on Indicator Monday, we’re breaking down one of the most misunderstood and overused tools in technical analysis. Not just what Bollinger Bands are, but how to actually use them to anticipate volatility, structure your trades, and avoid costly fakeouts.
Let’s start at the top.
What Are Bollinger Bands?
Created by trader and analyst John Bollinger in the 1980s, Bollinger Bands were designed to help visualize whether price was relatively high or low compared to its recent average.
The bands consist of three lines:
A 20-period Simple Moving Average (SMA)—this forms the middle band.
An upper band = SMA + 2 standard deviations.
A lower band = SMA – 2 standard deviations.
As price volatility increases, the bands expand outward. When volatility contracts, the bands pull tighter, forming what traders call a “squeeze.”
This gives you a dynamic frame to assess.
Is the price stretched?
Is volatility about to spike?
Is this momentum or just mean reversion?
What Makes Bollinger Bands So Useful?
Unlike static tools like trendlines or horizontal support/resistance, Bollinger Bands move with the market. They react to both price and volatility, making them incredibly useful in fast-changing conditions, something every intraday trader or scalper deals with daily.
Here’s what they bring to the table:
Volatility Measurement—without needing a separate indicator
Visual boundaries for short-term overbought/oversold behavior
Signal build-up during range-bound periods
Entry/exit frameworks for both breakout and mean-reversion traders

But like all tools, they’re only as good as how you use them.
How Bollinger Bands Work in Real Markets
Let’s break it down with actual trader behavior:
1. Mean Reversion (Fade the Edges)
When price hits the upper band, it’s often viewed as overbought.
When price hits the lower band, it’s considered oversold.
This leads to classic “snapback” trades shorting near the top, buying near the bottom with the expectation that price will revert toward the middle band (the SMA).
Best used in sideways markets with clear range behavior.
Think of Nifty consolidating between 22,400 bands, flattening, and cleaning edges.
2. The Bollinger Squeeze (Volatility Breakout Setup)
A tight squeeze = price compression = something’s brewing.
When the bands contract for an extended period, it signals low volatility, which often precedes a sharp breakout.
The trick? The breakout direction isn’t obvious.
You’ll need confirmation: volume spikes, structure breaks, or confluence with other tools (e.g., MACD, RSI, VWAP).
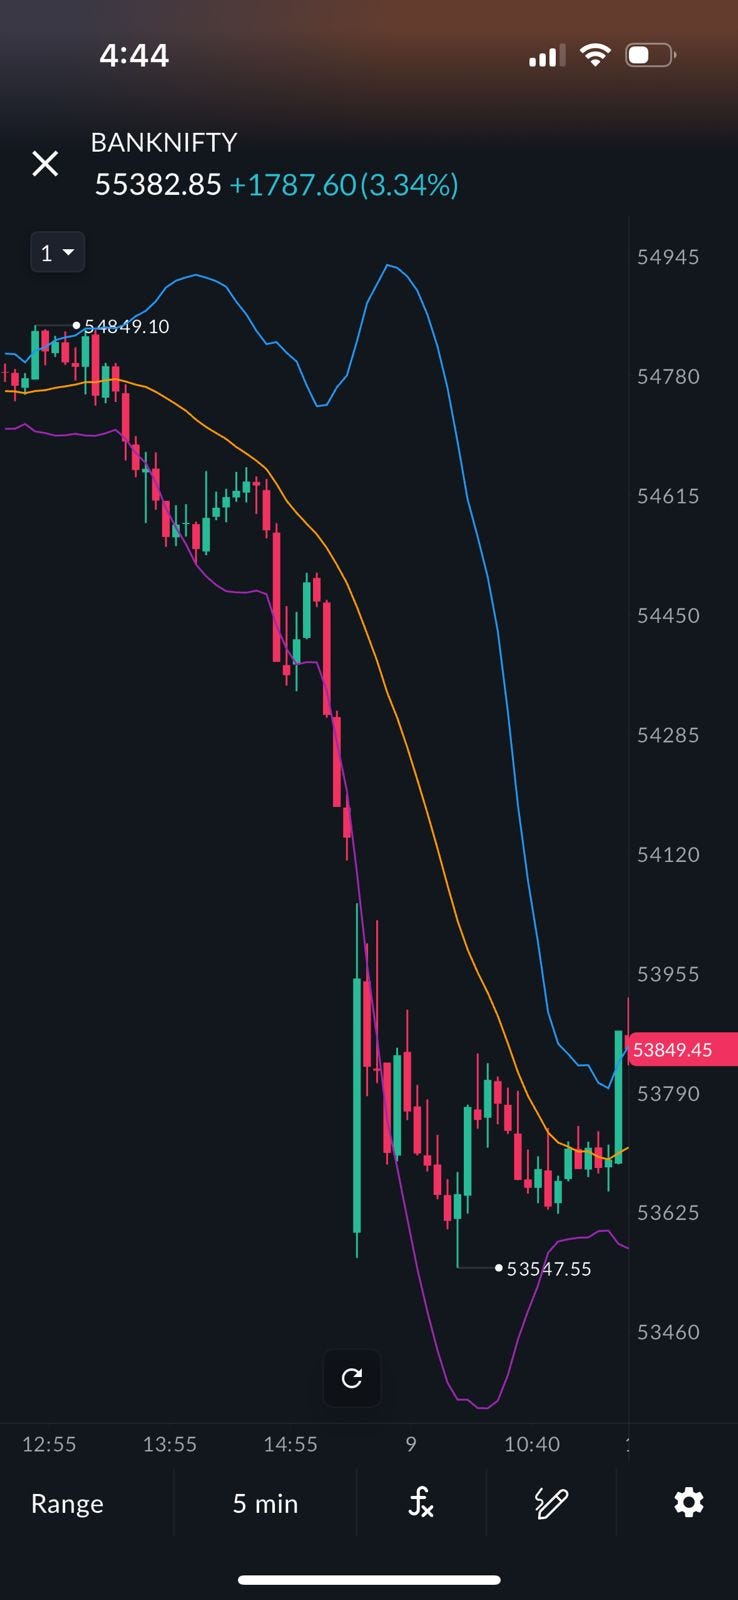
For example, in Bank Nifty, a multi-hour squeeze near support + breakout candle with volume = trade setup.
Common Bollinger Band Strategies
Let’s look at how traders build actual strategies with Bollinger Bands:
Strategy 1: Bollinger + RSI (Fade Setup)
Wait for the price to hit the upper band + RSI > 70 → look for a short setup.
Wait for the price to hit the lower band + RSI < 30 → look for a long setup.
Add confirmation via volume or reversal candles.
Useful in choppy, range-bound markets
Don’t use in strong trends RSI stays overbought/oversold
Strategy 2: Bollinger Squeeze + EMA Crossover
Identify a tight Bollinger Band squeeze on a 5-min or 15-min chart.
Wait for the 9 EMA to cross the 21 EMA + breakout above the band with volume.
Trade breakout direction; use middle band or trailing SL.
Great for scalpers, breakout traders
Needs disciplined SL, as false breakouts are common

What Bollinger Bands Won’t Tell You
Here’s the part many traders miss.
Bollinger Bands show you relative price, not trend direction. That means
Riding the Bands is real: In strong trends, price can keep hugging the upper/lower band for hours or days.
Mean reversion fails during trend acceleration.
Squeezes can fake out a break on one side and reverse hard.

Don’t use them in isolation. They’re best paired with price structure, volume, RSI, or momentum filters.
Why We Included Bollinger Bands in Sahi
Because volatility is the language of the market, and Bollinger Bands help you read it.
Whether you’re watching Nifty squeeze into a pre-news event or trying to spot if that move in Reliance is real, Bollinger Bands help you:
See when things are stretched
Catch setups forming during compression
Add volatility structure to your price-based analysis
Inside Sahi, you can:
Add Bollinger Bands instantly from the Indicators menu
Combine them with volume, RSI, or moving averages for layered setups
Use them in Scalper Mode or on HappyIndex in Practice Mode to test your reaction time in fast markets
We’ve made the indicator responsive, customizable, and intuitive so you spend less time adjusting and more time trading.
Sahi’s Take
Bollinger Bands aren’t just about pretty envelopes on a chart. They’re a lens helping you see where price is, not just where it’s been.
If you’re a scalper, they give you the rhythm of the market.
If you’re a swing trader, they help you time entries around volatility.
If you’re learning? They’re a masterclass in how markets compress, expand, and snap.
Try this:
Next time the bands squeeze, mark the zone. Add volume. Watch how price behaves.
You won’t see breakouts the same way again.