

If you've been trading for a while, you've probably heard of the Relative Strength Index (RSI). It's one of the most widely used indicators, yet one of the most misused and misunderstood.
Ask any beginner, and they’ll tell you: RSI above 70? Sell. RSI below 30? Buy. If only trading were that easy. The reality? RSI is a momentum tool, not a magic formula—and if you're relying on it blindly, you're likely missing the bigger picture.
Let's simplify it for you. 👇
What RSI Actually Measures (And Why It’s Not a Magic Signal)
RSI is a momentum oscillator that calculates the speed and magnitude of price movements over a set period (default: 14 days). It moves between 0 and 100 and is meant to identify overbought or oversold conditions.
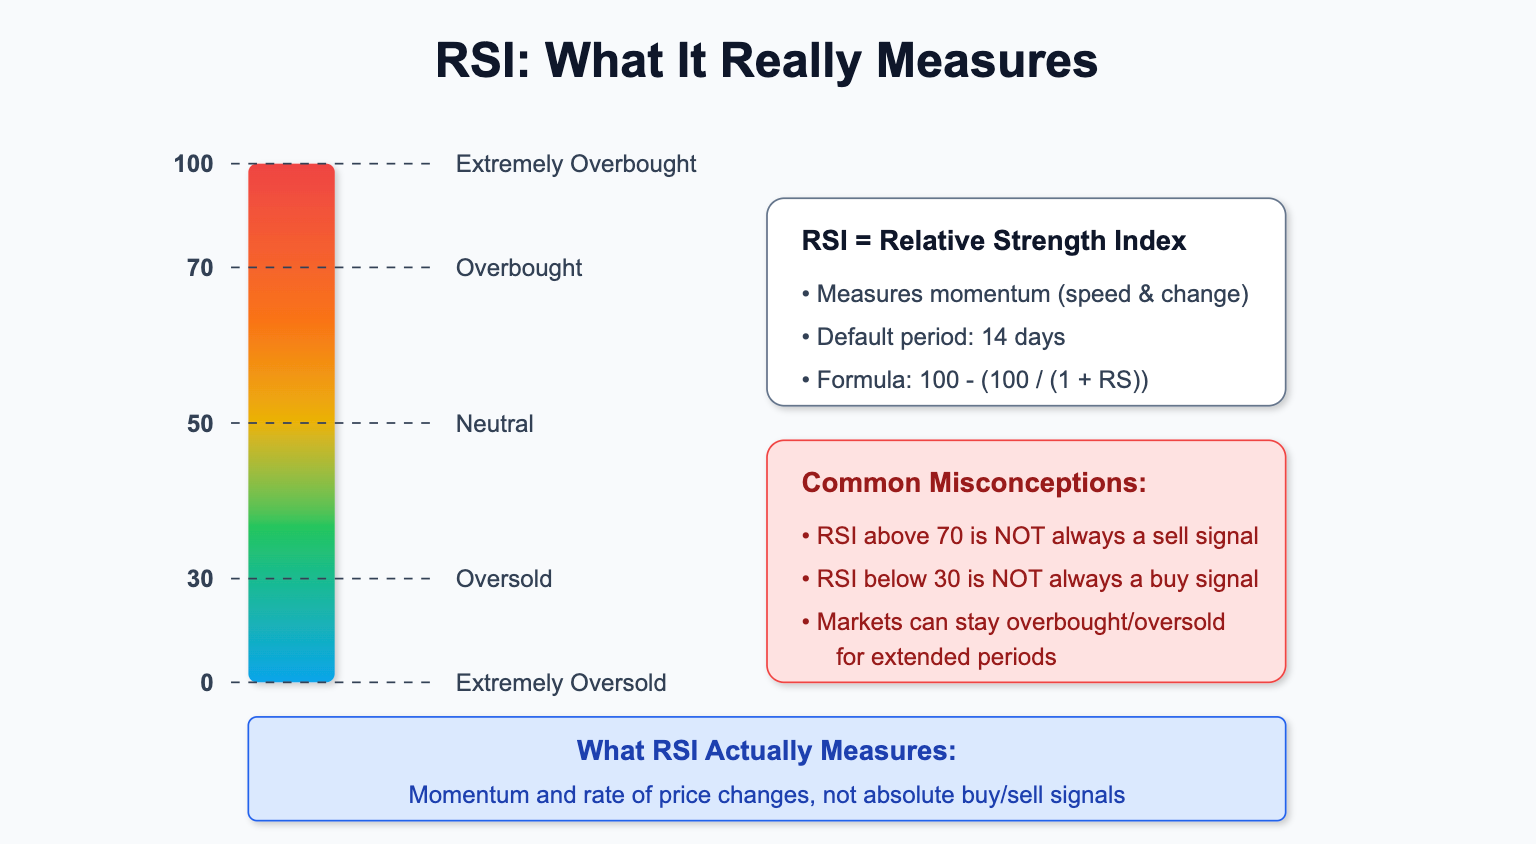
But here’s what most traders don’t get:
📌 Markets can stay overbought or oversold for days, even weeks. Selling too soon in a strong trend can cost you big time.
📌 RSI doesn't predict reversals; it measures momentum. A high RSI in a strong uptrend? That’s strength and a bullish momentum, not a shorting signal.
The Biggest RSI Mistakes Traders Make🚨
Thinking RSI alone is enough – No indicator works in isolation. RSI needs price action, volume, and trend analysis for real insights.
🚨 Blindly selling at 70 or buying at 30 – Some of the biggest rallies happen when RSI is overbought. Selling early = missing the move.
🚨 Ignoring Divergence – If the price makes a new high but RSI doesn’t, momentum is slowing. This is often a reversal warning before the price shows it.

How to Actually Trade RSI Like a Pro ✅
RSI Divergence = Smart Money Signal – If price is making higher highs but RSI is making lower highs, the trend is losing steam. The same applies in reverse for downtrends.
✅ Use RSI in Trend Context – If RSI is high in a strong uptrend, don’t short just because it’s overbought. Look for continuation signals instead.
✅ RSI Breakouts Lead Price Breakouts – RSI often breaks a trendline before price does. If RSI structure shifts, price usually follows.
✅ Pair RSI with Volume & Key Levels – An RSI signal near major support/resistance with rising volume? That’s where the best setups happen.
Next time you see RSI at 70 or 30, ask yourself: Is this actually a reversal, or is the trend just getting started? That one question could save you a lot of bad trades.
How do you use RSI in your trading? Let’s discuss below! 👇
#Trading #RSI #TechnicalAnalysis #Momentum #StockMarket #OptionsTrading #Futures