Trading isn’t just about price, it's about seeing the full picture. That’s why we’ve added new chart types and indicators to help you analyse markets with more clarity, context, and precision.
Here’s what’s new in this week’s release:
New Chart Types
We’ve expanded beyond the usual candlesticks and lines. Each new chart type gives you a different way to interpret market behaviour.
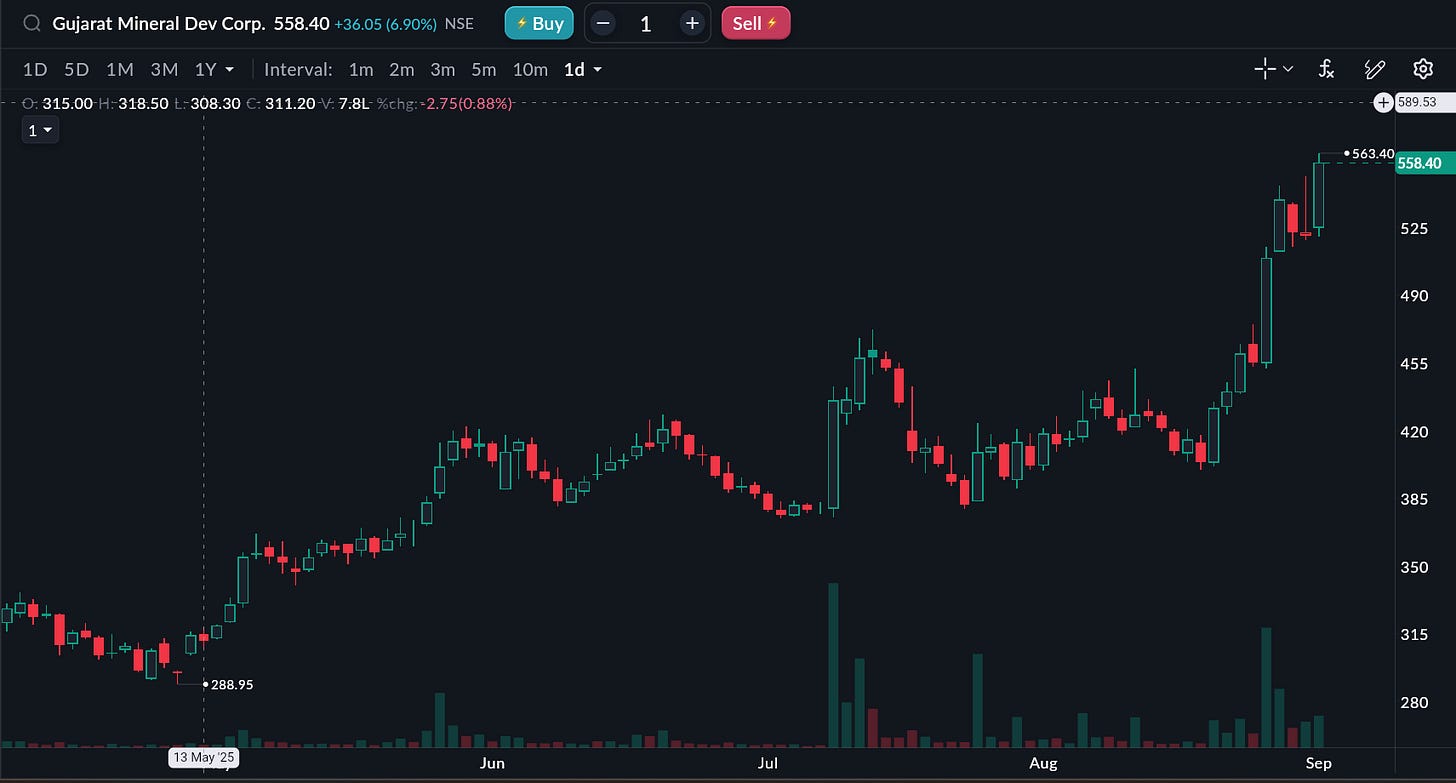
Hollow Candles
A cleaner, more visual spin on candlesticks.
Hollow body = bullish (close > open).
Filled body = bearish (close < open).
Wick size still shows high and low.
Why it matters:
Instantly differentiate bullish vs bearish sessions.
Makes trend continuation vs reversal patterns stand out.
Ideal for traders who want less clutter but full detail.
How to use it in Sahi:
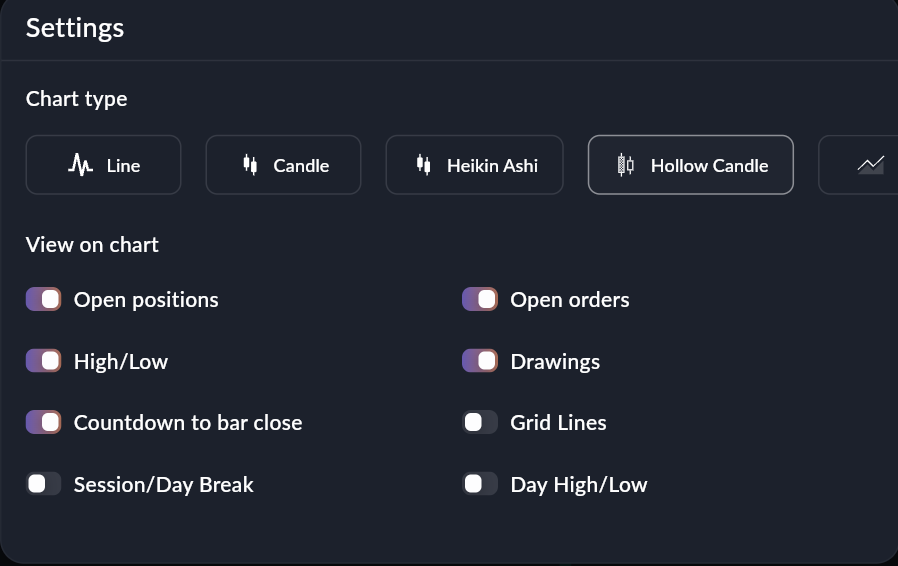
Click on Setting → Choose Chart Type→ Hollow Candle
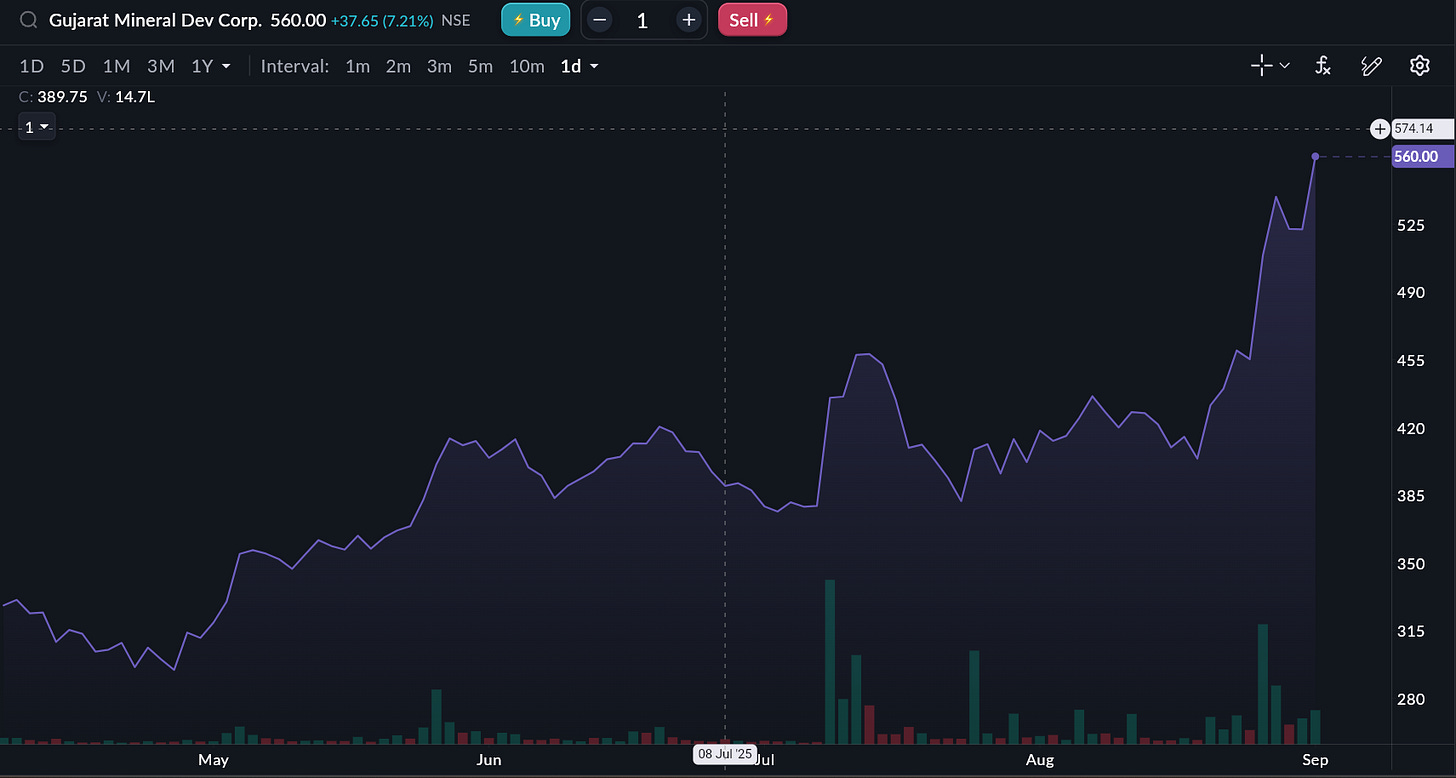
Area Chart
An Area Chart is essentially a line chart with the region below the line filled in. The shading emphasizes the magnitude of price movements, making trends easier to spot.
How to read it:
The slope of the line shows the direction of the trend (up = bullish, down = bearish, flat = sideways).
The filled region gives you a quick sense of the “strength” of that trend steeper slopes with a larger shaded area suggest stronger moves.
It’s less about individual highs/lows and more about the overall shape of price movement over time.
Why it matters:
Big-picture clarity: Ideal for long-term investors who want to see whether an index or stock has been steadily climbing or losing ground.
Quick comparisons: Area charts make it easier to compare different securities side by side.
Minimalist view: When you don’t need detailed candlestick patterns, area charts strip the noise away.
Example:
Looking at Nifty on an area chart over the past year, you can instantly see whether the market’s overall direction has been up, down, or range-bound ,without getting distracted by daily volatility.
How to use it in Sahi:
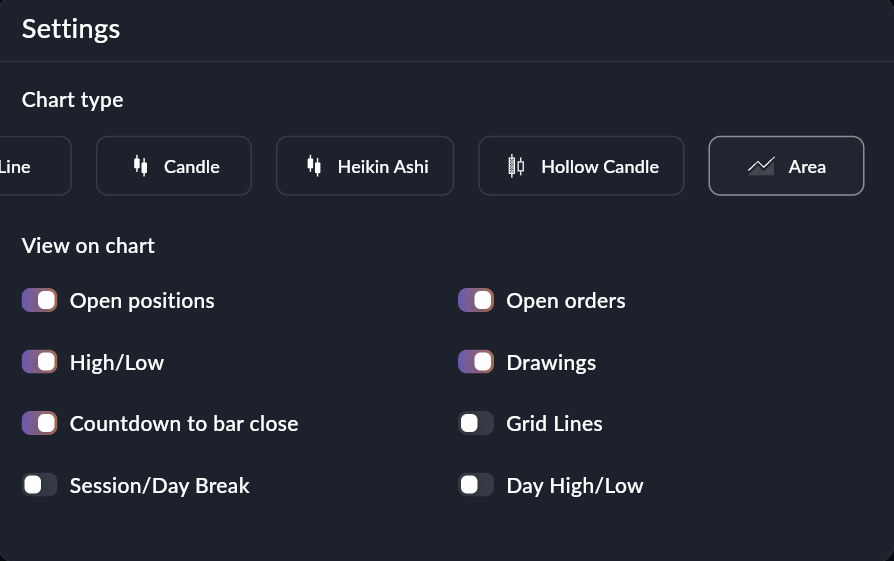
Click on Setting → Choose Chart Type → Area
New Indicators
On top of visual styles, we’ve added two widely used technical tools that sharpen your edge.
52-Week High & Low
The 52-week high and low are benchmarks every trader watches. Prices approaching these levels often attract big participation.
Why it matters:
Breakouts above the 52-week high can signal strong bullish momentum.
Drops near the 52-week low may indicate breakdown risk or bargain buying zones.
Helps you identify long-term support and resistance levels instantly.
Use case:
If a stock is consistently rejecting its 52-week high, it may be forming resistance. If it breaks through on strong volume momentum could follow.
How to use it in Sahi:
Enable from Indicators → 52-Week High/Low and see these critical levels marked on your chart.
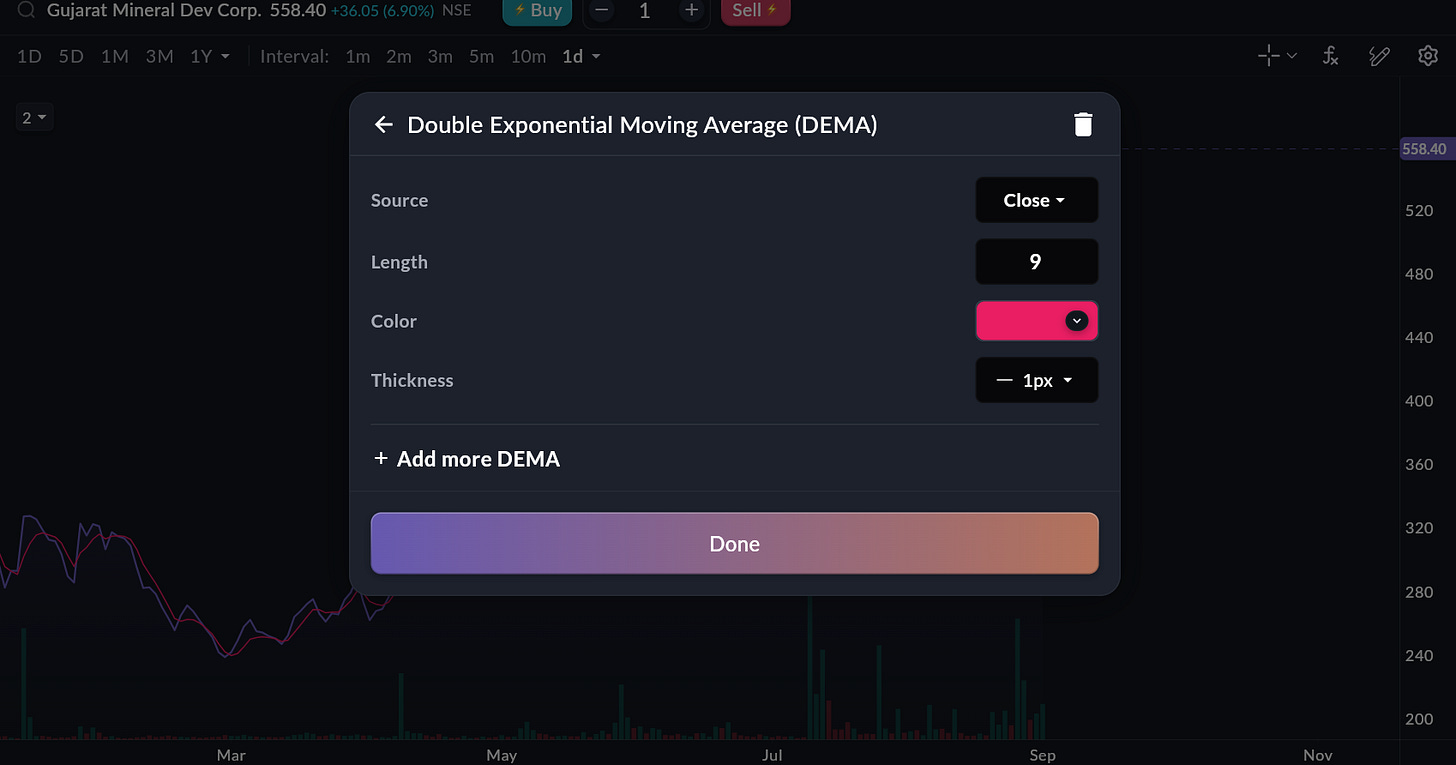
Double EMA (Exponential Moving Average)
The Double EMA (DEMA) is designed to overcome one of EMA’s biggest drawbacks: lag. A normal EMA gives more weight to recent prices, but it still trails the market when prices move quickly.
How it works:
DEMA combines a standard EMA with a second EMA of the EMA itself.
This mathematical adjustment reduces the lag that a single EMA produces.
As a result, the line hugs price action more closely while staying smoother than a short-period EMA.
Why it matters:
Faster signals: Entries and exits show up earlier than with a standard EMA.
Reduced noise: Unlike using very short EMAs (like EMA 5 or EMA 9), the DEMA stays smoother, avoiding constant whipsaws.
Trend clarity: Works well in strong trending markets, especially when paired with longer-term moving averages for confirmation.
Example:
If you overlay a 20-period EMA and a 20-period DEMA on Bank Nifty, you’ll notice that the DEMA responds quicker to sudden rallies or drops, giving you earlier confirmation of reversals.
How to use it in Sahi:
Go to Indicators → Double EMA and customize the period to fit your trading style.
Why These Updates Matter
More flexibility: Every trader has a different style. These new chart types help you see markets in the way that makes sense to you.
Better timing: The Double EMA can help reduce delays in signal generation.
Context-rich levels: A 52-week high/low isn’t just a number it’s a psychological anchor for institutions and retail traders alike.
At Sahi, we want you to trade with clarity, control, and confidence. These updates are designed to give you just that.
Try Them Out Today
Open any chart in Sahi.
Explore the new Chart Style options .
Add the new Indicators (52-Week High/Low, Double EMA).
Test how they fit into your strategy whether you’re scalping intraday or tracking long-term trends.
These features are live now. Log in, explore, and let us know what you discover. We'd love to hear your feedback.
We’re constantly evolving Sahi Charts with trader-first tools. If there’s a chart type or indicator you’d like us to add next, drop it in the comments. Your feedback drives our roadmap.


