

Charts often form recognisable patterns that repeat over time, reflecting collective trader behavior. These patterns can signal whether a trend might continue or reverse. By learning to spot chart patterns, you add another powerful tool to your trading toolkit. Let’s go through some common chart patterns – Head & Shoulders, Double Top/Bottom, and Cup & Handle – and discuss how to trade them. We’ll also tie in examples from the Indian market where these patterns have appeared.
Head & Shoulders (H&S):
This is a reversal pattern that typically signals a bullish-to-bearish trend change (for a normal head & shoulders). It’s called that because it looks like a head with two shoulders on either side.
It forms after an uptrend. You get a peak (left shoulder), then a small pullback, then a higher peak (head), then another pullback, then a lower peak roughly similar to the first (right shoulder).
Draw a line connecting the low points of the two pullbacks – this is the neckline. When price breaks below the neckline after the right shoulder, the H&S pattern is considered complete, and it often indicates the start of a downtrend.
Traders often trade this by selling or shorting on the break of the neckline, with a stop-loss above the right shoulder, and a target measured roughly by the height of the head minus the neckline (expected drop).
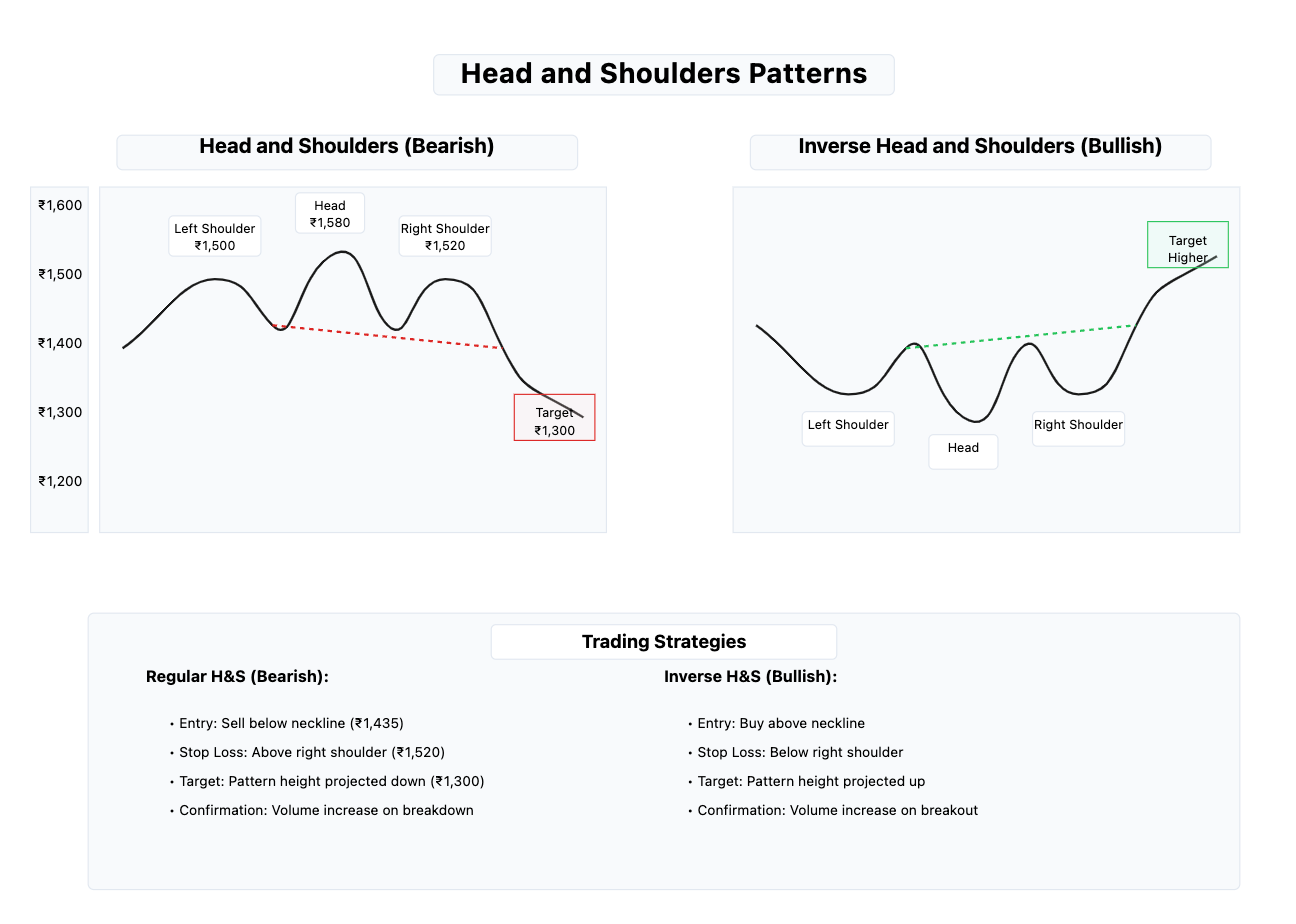
Example: Suppose Infosys stock was in an uptrend and rose to ₹1,500 (left shoulder), dipped to ₹1,420, then surged to ₹1,580 (head) and dipped to ₹1,450, then tried to go up again but only managed ₹1,520 (right shoulder) before falling. The neckline connecting the two dips is around ₹1,435. When Infosys’ price falls below ₹1,435, the H&S is confirmed – many traders would see that as a signal that the prior uptrend has reversed, potentially targeting a further drop (maybe towards ₹1,300 based on pattern height). They might execute a strategy like: sell at ₹1,430, stop-loss at ₹1,520, target around ₹1,300.
Double Top:
Looks like the letter "M". The price climbs to a peak, pulls back, then makes one more attempt to reach the same high but fails to break it, and then reverses downward. The two peaks at similar levels form the "double top". This pattern suggests that the uptrend hit a ceiling twice and now may reverse into a downtrend. The confirmation comes when price falls below the lowest point of the pullback between the two tops (often called the confirmation line or neckline of the "M"). Traders might short/sell when that line breaks, expecting further downside roughly equal to the height of the M.

Example: Tata Motors stock rallies to ₹500, drops to ₹470, then rallies again to ₹498 and starts falling. If it drops below ₹470 (the interim low), that completes a double top. Traders seeing this may conclude Tata Motors has formed a medium-term top around ₹500 and could decline further, maybe to ₹440 (approx height of the pattern subtracted).

Double Bottom:
The opposite, looks like a "W". Price falls to a low, bounces, then falls again to a similar low, and then starts rising. It signals a downtrend might be ending and an uptrend beginning. The confirmation is when price breaks above the high of the bounce between the two bottoms. Traders often buy on that breakout. Target can be the height of the pattern added to the breakout point.
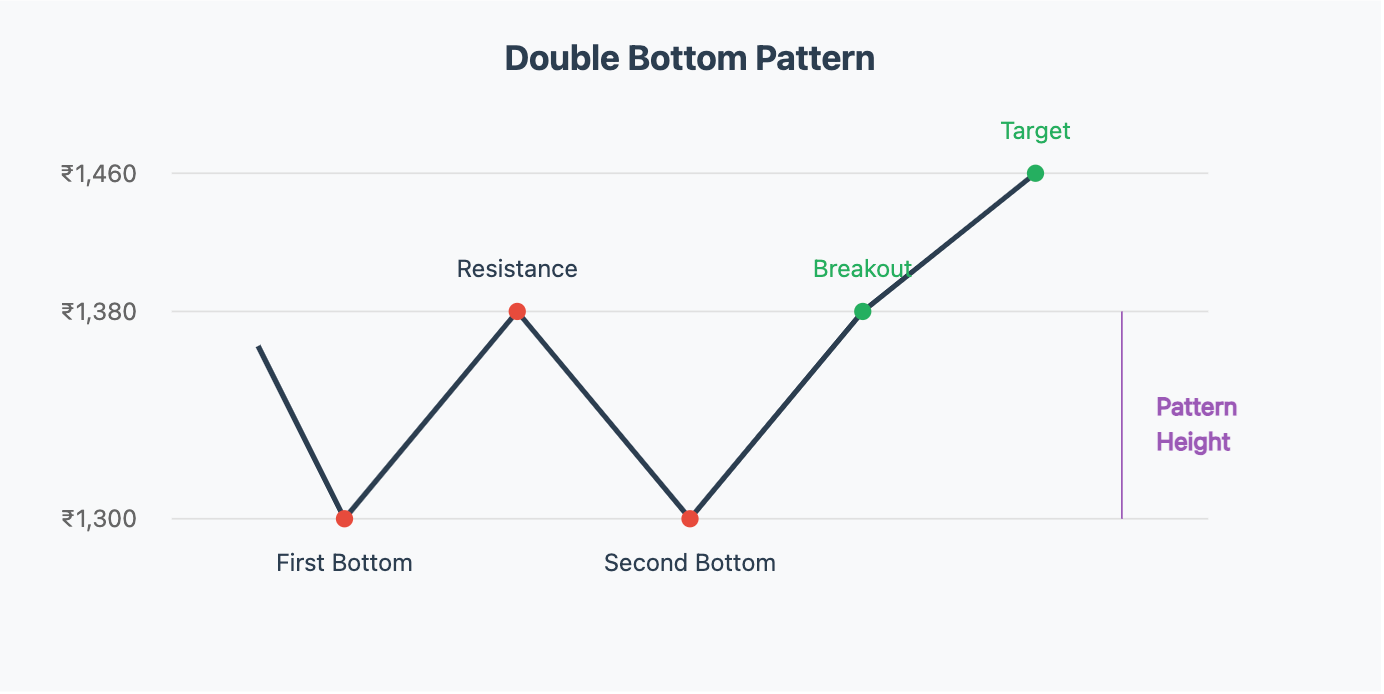
Example: HDFC Bank shares fall to ₹1,300, bounce to ₹1,380, then another wave of selling takes them to ₹1,310 (around the same zone as before) and then they start climbing. When the price later pushes above ₹1,380, the double bottom is confirmed – suggesting support around ₹1,300 is rock solid and the trend might be reversing up. A trader might buy on that break of ₹1,380, expecting a move up perhaps to around ₹1,460 (roughly the height of the W pattern).

Cup & Handle:
This is a bullish continuation pattern often seen in uptrends. It looks like, well, a cup with a little handle on the right:
The cup part is a U-shaped rounded bottom (like a bowl). It happens when a stock, in an uptrend, takes a longer breather: price declines gradually, then finds a bottom, then rises back toward the old high, forming a cup shape.
The handle is a smaller pullback that follows – a shorter period of consolidation or a dip after the cup. It’s like a little flag or sideways drift with a slight downward tilt usually.
The bullish signal comes when price breaks out above the handle’s upper trendline (or above the prior high that marks the lip of the cup). This breakout indicates the continuation of the uptrend, often leading to a strong rally. The expected move can be estimated by the depth of the cup.

Example: Imagine Asian Paints stock was in an uptrend at ₹3,000, then it slowly pulled back over a month to ₹2,700, and over the next month climbed back to ₹3,000 – that forms a cup. Then for two weeks, it trades sideways/down slightly between ₹3,000 and ₹2,900 – that’s the handle. When Asian Paints’ price then pushes above ₹3,000 with volume, it’s breaking out of the cup and handle. Traders see this as a strong bullish continuation sign and might buy, expecting a significant move up perhaps to ₹3,300 or more (cup depth ₹300 added). A stop might be placed just under the handle’s low (around ₹2,900 in this case) to manage risk in case the pattern fails.
Trading Strategies with Patterns:
When trading chart patterns, here are a few tips:
Confirmation is Key: Don’t assume a pattern will complete; wait for the breakout/breakdown. E.g., a Head & Shoulders isn’t tradable until it actually breaks the neckline – until then, the “right shoulder” could always morph into something else.
Volume: Volume can strengthen the signal. In a Head & Shoulders, ideally volume is highest on the left shoulder and head, and lower on the right shoulder, then spikes on the break of the neckline (showing strong selling). In a breakout from a Cup & Handle, a volume surge on the breakout day adds confidence that the move is genuine (lots of buyers jumping in).
Pullback or Retest: Often after breaking out of a pattern, price might return to “test” the breakout level (e.g., come back to the neckline or broken resistance, which now acts as support) and then continue in the direction of the breakout. Some traders prefer entering on this pullback for a better price, rather than the initial breakout.
Pattern Failure: Always be prepared for a pattern that fails. Sometimes what looks like a double top could just be a temporary pause and the price blasts through on a third try. If you traded the pattern and the breakout doesn’t follow through, respect your stop-loss. It’s part of trading.

Real-World Indian Stock Examples:
A famous example was the Nifty 50 index in 2020: after the COVID crash, it formed something akin to a Cup & Handle from June to August and broke out to new highs, continuing the bull run.
Reliance Industries in the past has shown several patterns; one could say in 2021 it formed an inverse Head & Shoulders roughly around the time it bottomed out during a market dip, giving an early signal for the next leg up when it broke the neckline.
Infosys might have a historical instance of a double bottom around a bad news event – say it dropped to ₹900, bounced, dropped to ₹920 (similar level), then rallied as confidence returned, rewarding those who spotted the W-shape.
By recognizing these patterns, you start to anticipate possible future moves rather than just react. It’s almost like having a cheat sheet of common market behaviors. The more charts you look at, the more you’ll see these patterns in action. Up next, we’ll discuss something that goes hand-in-hand with price patterns: volume and market sentiment. After all, patterns and indicators are more convincing when lots of traders (volume) are voting the same way.