

The option chain is your information hub for options on a given underlying. It’s basically a table listing all the available option contracts (calls and puts) for various strikes and expiries, along with their prices, OI, etc. Learning to read the option chain is like learning to read a map of the options market. Let’s walk through an option chain, taking NIFTY as our example, and explain the key columns and how to use them.
Structure of an Option Chain: On NSE’s website (or any trading platform), an option chain is typically presented as a two-sided table:
The left side lists data for Call options.
The right side lists data for Put options.
Down the middle, you have the Strike Prices (usually sorted from lowest to highest).
Often, the row corresponding to the ATM strike (or closest to current price) is highlighted for convenience


For each strike, you’ll see various columns for calls and corresponding columns for puts. Key columns include:
LTP (Last Traded Price): The last traded price of that option contract. (Sometimes also show the Change or % Change from previous day).
Bid Price and Ask Price: The best buy price (bid) and best sell price (ask) in the market for that option. For liquid options (like Nifty ATM), the bid-ask spread will be small (maybe a rupee or less). For illiquid strikes, the spread could be wide.
Bid Quantity / Ask Quantity: How many contracts are being bid/offered at those prices.
Volume: How many contracts traded during the day for that strike.
Open Interest: How many contracts are open for that strike (as discussed in the OI section).
Possibly IV (Implied Volatility): Some chains show the implied vol for each strike’s option.
Change in OI: Some display how OI changed from yesterday (to see buildup/unwinding).
Intrinsic/Extrinsic: Not explicitly given, but you can infer intrinsic by seeing how far ITM, etc.

The option chain for different expiries can be accessed by selecting the expiry date. By default, you might see the near-month (or near-week) expiry. Others are a click away.
Identifying ATM, ITM, OTM on the Chain: As mentioned, the chain often highlights ITM options. For instance, NSE’s site shades ITM options in yellow. If Nifty is 18,000

On the call side, all strikes below 18,000 are ITM calls (highlighted), and strikes above are OTM (no highlight).
On the put side, all strikes above 18,000 are ITM puts (highlighted), and below are OTM puts. The ATM strike (18,000) might be considered ITM on one side (could be arbitrarily highlighted either or both). This shading helps you quickly see which options have intrinsic value. An option chain is a “quick visualisation to understand which option strike is ITM, OTM, ATM... along with other information like OI and volume” .
Using the Option Chain:
Gauge Market Sentiment (OI): Look at OI columns for calls and puts. Where is OI highest on calls? On puts? For example, you see at the 18,500 strike Call, OI is the highest among calls, and at 17,500 strike Put, OI is highest among puts. This hints that 17,500 could be a support (put writers confident above that) and 18,500 a resistance (call writers galore there). You also check change in OI intraday – if during a market upmove, OI at 18,500 call increased, that means more call writing (resistance building). If it decreased, maybe short covering (resistance clearing).
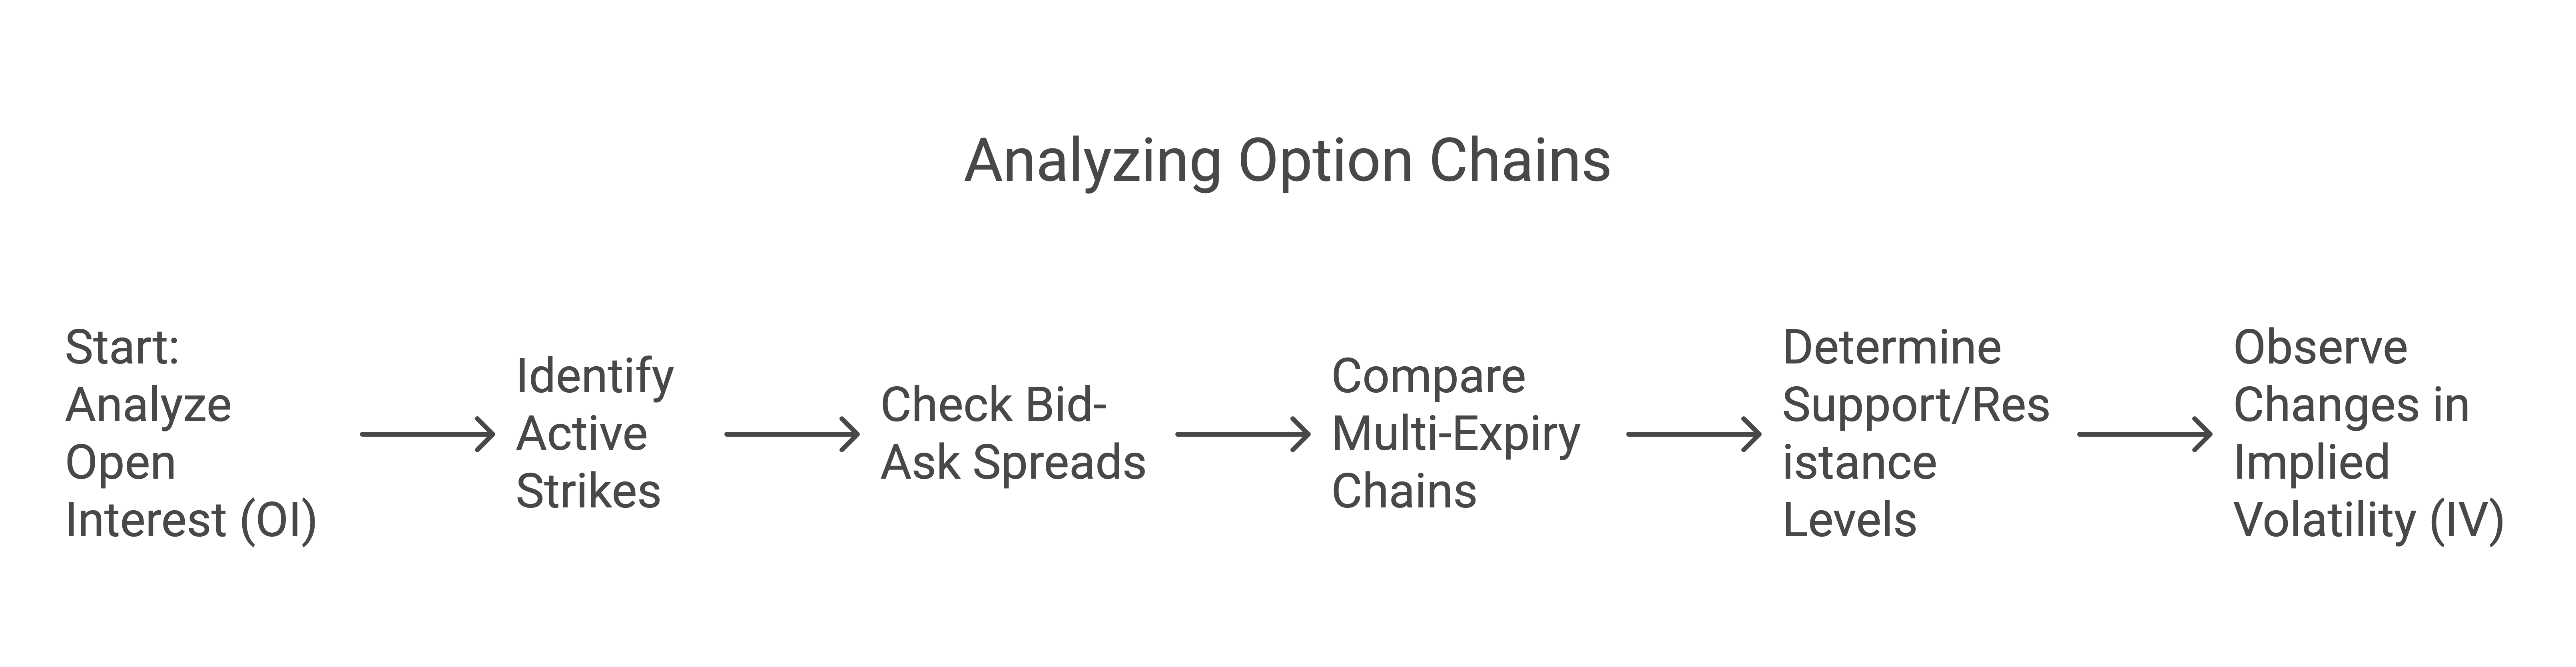
Identify Active Strikes (Volume): Option chain shows which strikes are trading a lot (volume). Nifty and BankNifty ATM and nearby strikes usually have huge volume. Thin volume at a strike means be careful – you might face liquidity issues entering/exiting there.
Check Bid-Ask Spreads: Especially if you want to trade a specific strike, look at bid vs ask. For liquid strikes, maybe Nifty ATM call is ₹150 bid – ₹151 ask (tight spread). Far OTM might be ₹2 bid – ₹3.5 ask (wide! If you buy at 3.5, and immediate fair value might be near 2, you’re down significantly on entry). Wide spreads can also indicate risk or low interest. Market makers widen spreads in volatile times, or for far expiries.
Multi-Expiry View: By comparing chains of different expiries, you can see how OI and IV shift. For example, maybe the current week has huge OI at certain strikes, but next month’s chain shows a different story (maybe longer-term positioning).
Support/Resistance Levels: As discussed, use OI as one indicator. Also, note price build-ups: e.g., if an ATM option suddenly jumped in price and huge volume, something might be brewing.
Changes in IV: If your platform shows IV per strike, you might see skew – e.g., far OTM puts showing higher IV%. Or you might see overall IV rising or falling compared to yesterday (implying event risk changes or demand changes)


Example Walkthrough: Let’s say Nifty is 18,000.
You open the option chain for this week’s expiry. You see:
18,000 Call: LTP ₹120, OI 3 million, Volume 200k, IV 15%.
18,000 Put: LTP ₹110, OI 3.5 million, Volume 250k, IV 15%.
18,100 Call: LTP ₹80, OI 2.5 million.
17,900 Put: LTP ₹85, OI 2.8 million.
Highest call OI is at 18,500 strike (say 4 million OI), highest put OI at 17,500 (5 million OI).
Interpretation: The ATM call and put have similar IV and huge volume, indicating lots of trading action (likely both speculators and hedgers). Puts seem slightly more pricey (110 vs calls 120 – not a big difference, but maybe due to slightly higher demand or a mild bearish skew). The support looks stronger at 17,500 (massive put OI) and resistance at 18,500. If you also notice that in the last hour, 18,200 call OI jumped, it could mean traders are building shorts there, thinking Nifty won’t cross 18,200 this expiry.
You also glance at next week’s expiry chain: Perhaps OI is building at 18,000 call there too. Could mean people rolling positions or expecting market to hover around that level.
Bid-Ask Caution: In less liquid options (like some stock options or far week BankNifty options), always place limit orders around the midpoint of bid-ask if spread is wide. Market orders can fill at bad prices. The chain helps you judge this.
In a nutshell, the option chain is an indispensable tool. It shows real-time sentiment (through OI and price), and helps in identifying key market levels. It’s also very useful for strategy building (though we’re not covering specific strategies here, you’d use the chain to pick strikes for strategies like spreads).
Armed with chain-reading skills, let’s talk about something every trader must deal with: the capital and margin requirements to trade options in India, and the regulations around them.